-
Help on using profiler????
This is the first time i am using knoppix(bootable)...i was trying to run a 'c' program with profiling option as follows:
$gcc -pg -oprogram program.c
$./program
file with name of gmon.out is created
and then whenever i try to use gmon.out
$gmon.out or $./gmon.out
it gives an error:: permission denied
please help 
-
Senior Member
registered user
This is not related to Knoppix & should be in The Lounge.
The key to making it all work is to compile your program with the '-static' option. Then running the program. Then running the command: gprof 'your-program' gmon.out. I figured out how to do all this using google.
program.c
Code:
#include <stdio.h>
main ()
{
        FILE *a;
        printf("%s\n","Hello World");
}
Code:
james@dualcrush:~/gcctest$ ls
program.c
james@dualcrush:~/gcctest$ gcc -pg -static -oprogram program.c
james@dualcrush:~/gcctest$ ls
program  program.c
james@dualcrush:~/gcctest$ ./program
Hello World
james@dualcrush:~/gcctest$ gprof program gmon.out
Flat profile:

Each sample counts as 0.01 seconds.
 no time accumulated

  %   cumulative   self              self     total
 time   seconds   seconds    calls  Ts/call  Ts/call  name
  0.00      0.00     0.00        1     0.00     0.00  main

 %         the percentage of the total running time of the
time       program used by this function.

cumulative a running sum of the number of seconds accounted
 seconds   for by this function and those listed above it.

 self      the number of seconds accounted for by this
seconds    function alone.  This is the major sort for this
           listing.

calls      the number of times this function was invoked, if
           this function is profiled, else blank.

 self      the average number of milliseconds spent in this
ms/call    function per call, if this function is profiled,
           else blank.

 total     the average number of milliseconds spent in this
ms/call    function and its descendents per call, if this
           function is profiled, else blank.

name       the name of the function.  This is the minor sort
           for this listing. The index shows the location of
           the function in the gprof listing. If the index is
           in parenthesis it shows where it would appear in
           the gprof listing if it were to be printed.
♀
                     Call graph (explanation follows)


granularity: each sample hit covers 4 byte(s) no time propagated

index % time    self  children    called     name
                0.00    0.00       1/1           __libc_start_main [559]
[1]      0.0    0.00    0.00       1         main [1]
-----------------------------------------------

 This table describes the call tree of the program, and was sorted by
 the total amount of time spent in each function and its children.

 Each entry in this table consists of several lines.  The line with the
 index number at the left hand margin lists the current function.
 The lines above it list the functions that called this function,
 and the lines below it list the functions this one called.
 This line lists:
     index      A unique number given to each element of the table.
                Index numbers are sorted numerically.
                The index number is printed next to every function name so
                it is easier to look up where the function in the table.

     % time     This is the percentage of the `total' time that was spent
                in this function and its children.  Note that due to
                different viewpoints, functions excluded by options, etc,
                these numbers will NOT add up to 100%.

     self       This is the total amount of time spent in this function.

     children   This is the total amount of time propagated into this
                function by its children.

     called     This is the number of times the function was called.
                If the function called itself recursively, the number
                only includes non-recursive calls, and is followed by
                a `+' and the number of recursive calls.

     name       The name of the current function.  The index number is
                printed after it.  If the function is a member of a
                cycle, the cycle number is printed between the
                function's name and the index number.


 For the function's parents, the fields have the following meanings:

     self       This is the amount of time that was propagated directly
                from the function into this parent.

     children   This is the amount of time that was propagated from
                the function's children into this parent.

     called     This is the number of times this parent called the
                function `/' the total number of times the function
                was called.  Recursive calls to the function are not
                included in the number after the `/'.

     name       This is the name of the parent.  The parent's index
                number is printed after it.  If the parent is a
                member of a cycle, the cycle number is printed between
                the name and the index number.

 If the parents of the function cannot be determined, the word
 `<spontaneous>' is printed in the `name' field, and all the other
 fields are blank.

 For the function's children, the fields have the following meanings:

     self       This is the amount of time that was propagated directly
                from the child into the function.

     children   This is the amount of time that was propagated from the
                child's children to the function.

     called     This is the number of times the function called
                this child `/' the total number of times the child
                was called.  Recursive calls by the child are not
                listed in the number after the `/'.

     name       This is the name of the child.  The child's index
                number is printed after it.  If the child is a
                member of a cycle, the cycle number is printed
                between the name and the index number.

 If there are any cycles (circles) in the call graph, there is an
 entry for the cycle-as-a-whole.  This entry shows who called the
 cycle (as parents) and the members of the cycle (as children.)
 The `+' recursive calls entry shows the number of function calls that
 were internal to the cycle, and the calls entry for each member shows,
 for that member, how many times it was called from other members of
 the cycle.

♀
Index by function name

   [1] main
james@dualcrush:~/gcctest$
-
Thanx
Thanx alot ...it worked with the static option.....
but what is the meaning of static here??? 
 Posting Permissions
- You may not post new threads
- You may not post replies
- You may not post attachments
- You may not edit your posts
-
Forum Rules

Dell PowerEdge M630 Blade Server 2x Xeon E5-2680 v4, 2F3MP , 4GDP5 ,R10KJ ,JVFVR
$95.20

Dell PowerEdge M640 Blade Barebone Server Dell P/N: HHB006 Tested Working
$149.99
Cisco UCS 5108 Blade Server Chassis Enclosure N20-C6508 4x PSU 8x Fans 2x Fabric
$174.99
Dell Poweredge VRTX 25Bay 2.5" 2x PERC 8, 2xCMC, I/O 1GB Pass Through, 4x PS
$578.08
Dell PowerEdge VRTX 2.5"x25 Bay Blade Enclosure 4x1600W + 4X M640 (4X Blades)
$1599.99
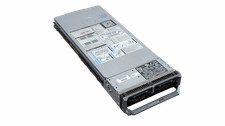
Dell PowerEdge M620 Blade Server 2x Xeon E5-2680v2 2.8ghz 20-Cores | 128GB
$149.99
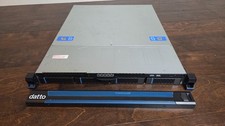
Datto S4P10 1U Blade Rack Server Intel Xeon D-2143IT 2.20GHz 48GB DDR4 4-Bay PSU
$197.76
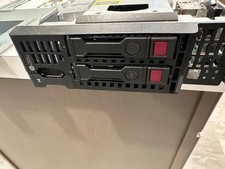
HP ProLiant BL460c Gen9 DUAL E5-2690v3 DDR4 ECC 2x CADDY NO DRIVES NO MEMORY/RAM
$30.00
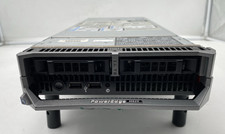
Dell PowerEdge M620 Blade Server 2x Xeon E5-2680v2 256GB DDR3 RAM NO HDD
$349.99
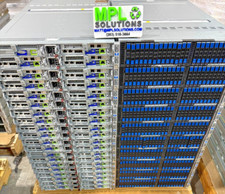
NETAPP HCI NAF-1701 SuperMicro Server 4X BLADE H410C 8X GOLD 5120 4 NODE SERVER
$1499.97



 Reply With Quote